The coastline of Argentina has a length of 3160.9 miles and covers an area of 1,081,080 Sq. miles.
The argentine oceanic territory has a platform which gains wide and depth towards the south. And at a distance of 200 miles it reaches a depth of 218.72 yards.
The height of the waves becomes relevant in the South and Southeast region of the big island of Tierra del Fuego, where waves can vary from 1.75 to 2 meters. On the North coast of Tierra del Fuego and the South of “Puerto Deseado” waves reach values ranging from 1.50 to 1.75 meters while on the rest of the Patagonia coast and Buenos Aires annual average height is 1.25 to 1.7 meters.
In Bahía Blanca, Golfo de San Matías, Golfo de San Jorge and south of San Julián Port values are between 1 to 1.25 meters. In these cases, we are at the limit of the minimum values in order to use the wavepower devices.
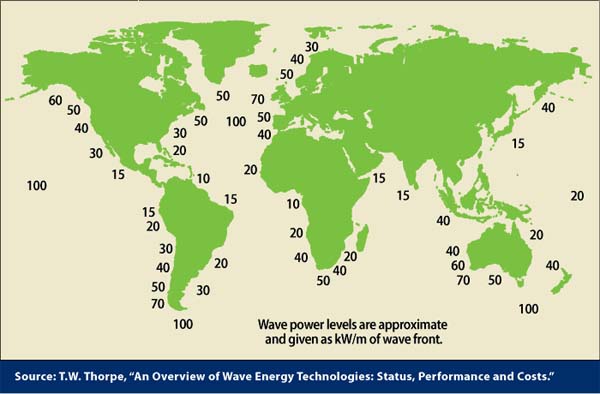
To understand where our sea is located respect to the other coasts of the world, we can use the following world map where the values of wave energy are expressed in the form of power per linear unit, there you can see that the latent power in our coastline is between 30 and 100 KW per metre of wave.
Wave energy distribution according its direction
In much of our coastline, marine waves tend to be ordered and align itself due to the shallowness that exists, but in the deep sea, waves are fully developed in free form. Studies that provides Argentine’s bibliography refers us to a paper presented at the World Congress on Engineering that take place in Buenos Aires
In picture 7 there are graphics where you can appreciate the energy as a function of wave direction variability in different parts of deep waters in the Argentine sea (Figure 6), this kind of tool allows you to determine the best location for wavepower devices to get maximum performance.
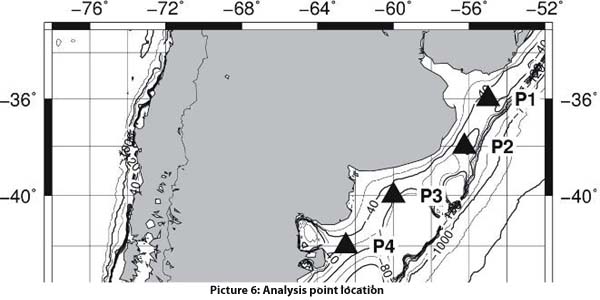
Source: Ricardo Das Neves, Sonia Chandare. Description of the wavepower resource in Argentine’s coast.
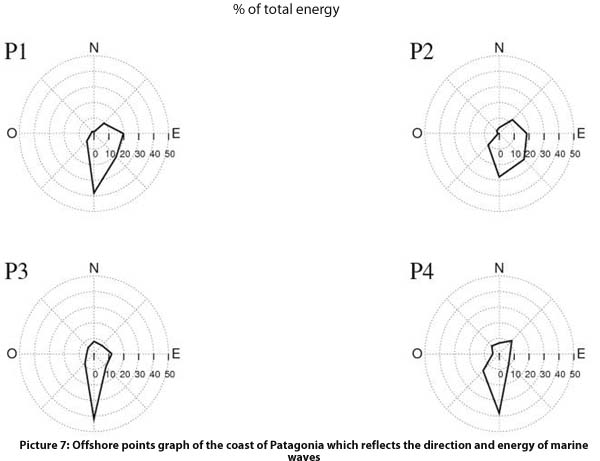
Source: Ricardo Das Neves, Sonia Chandare. Description of the wavepower resource in Argentine’s coast.
For the calculation of the available wave energy it must be considered the height of the waves so this way you can determine the power (KW/m of wavefront)
Thanks to studies of ocean behavior, we can show through charts the relationship between the power of waves regarding the occurrence of the phenomenon and also the total energy is indicated (Picture 8).
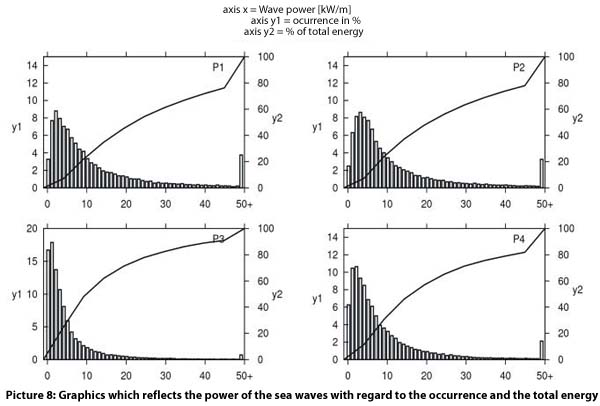
Source: Ricardo Das Neves, Sonia Chandare. Description of the wavepower resource in Argentine’s coast.
The ideal device will be one who can take advantage of the higher flow of waves both in direction and height.
